SCOPES EDUCATIONAL PIECE
Scopes are present in every aspect of video production in one form or another. . Cameras and software often have in built scopes and you can even get dedicated hardware scopes. These hardware scopes are the most accurate way to monitor your signal and with a variety of different scope displays you can check every aspect of the image.
Our perception of colour and luminance can be quite easily influenced and as such it is very important to be have a non-biased representation of your image.
Waveform
Waveforms reflect your image from left to right and can be configured to show a specific colour channel or all 3. You can even use some waveforms to display only the luminance channel.
Normally the Y axis on a waveform will display 0 to 700mV or 0 to 100 IRE as this is the range of a legal broadcast signal peak to peak. If we are viewing 10 bit scopes then values on the Y axis may show 0 – 1023, or the full 10 bit range of the image. In both scenarios, 0 indicates black and 100/700/1023 indicates white.
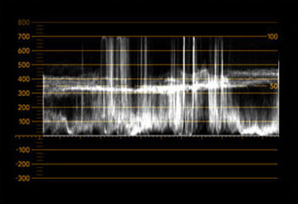
You can assess contrast through from a waveform by comparing the top and bottom points. Points further away from each other indicate there is a larger range between black and white meaning there is a greater contrast.
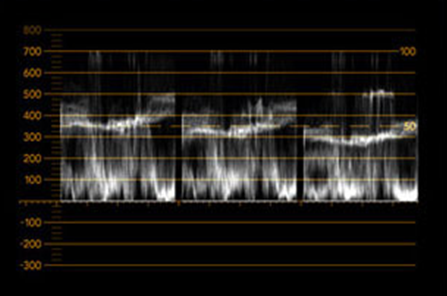
Parade
Much like a waveform, parades use the same X and Y axes however your channels, rather than being overlayed on top of each other, are split individually. This allows you to check for any errors within a specific channel. Detecting errors like colour casts can be very easy when using a parade.
Histogram
Histograms display an analysis of how many pixels of each color channel lie at each percentage of tonality. The representation is plotted on a graph of 0 – 100 along the X axis, with 0 being black and 100 being white. The vertical axis shows pixel density at that specific value.
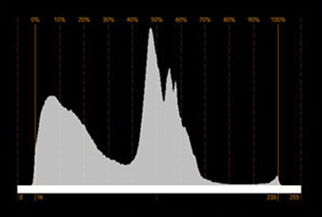
Evaluating the left, middle and right points of each graph allows the user to evaluate the color balance in the shadows, mids and highlights. These are often used on set to help camera people nail exposure.
Vectorscope
Vectorscopes are used to measure the saturation of hue values within a signal. These measurements are done by displaying a graph, originating from a centre point that is considered 0% saturation. IF we think of a traditional colour wheel being around the edge of the graph, we can then understand how saturated a specific hue is by the point originating from the centre as the angle it extends at and the length of then extension define hue and saturation.
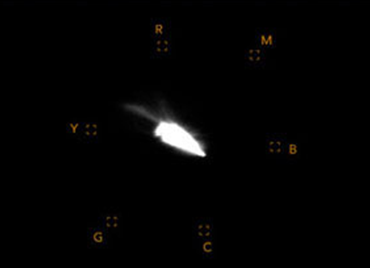
A good way to understand a vectorscope is to feed it with a colour bar test pattern. As most vectorscopes have 75% target boxes for Red, Magenta, Blue, Cyan, Green and Yellow hues a colour bar test pattern should show a graph that hits each of these targets.