
Earth Systems Lab 2024 - 3D SAR for Forest Biomass
Earth Systems Lab 2024
3D SAR for Forest Biomass
Published 20 JUNE 2025
Earth Systems Lab (ESL) by FDL Europe, applies AI technologies to space science, to push the frontiers of research and develop new tools to help solve some of the biggest challenges that humanity faces. These include the effects of climate change, predicting space weather, improving disaster response and identifying meteorites that could hold the key to the history of our universe.
FDL Europe is a public-private partnership with the European Space Agency (ESA) and Trillium Technologies. It works with commercial partners such as Scan, NVIDIA, IBM, Google, Airbus amongst others to provide expertise and the computing resources necessary for rapid experimentation and iteration in data intensive areas.
ESL 2024 was a research sprint hosted by the University of Oxford, taking place over a period of eight weeks in autumn 2024. The interdisciplinary teams address tightly defined problems and the format encourages rapid iteration and prototyping to create meaningful outputs to the space program and humanity.

Project Background
Synthetic Aperture Radar (SAR) is a remote sensing technology that uses radar signals to create detailed images of an area. Unlike optical sensors, which rely on visible light and are often obstructed by clouds or forest canopies, SAR operates in the microwave spectrum, allowing it to penetrate through dense vegetation, smoke, and atmospheric conditions. This capability makes SAR especially useful for monitoring forest environments where traditional optical systems struggle to capture accurate data beneath the canopy. SAR systems measure the backscatter of radar signals, which varies based on surface structure, moisture, and vegetation, providing valuable information for assessing forest biophysical parameters such as tree height and biomass.
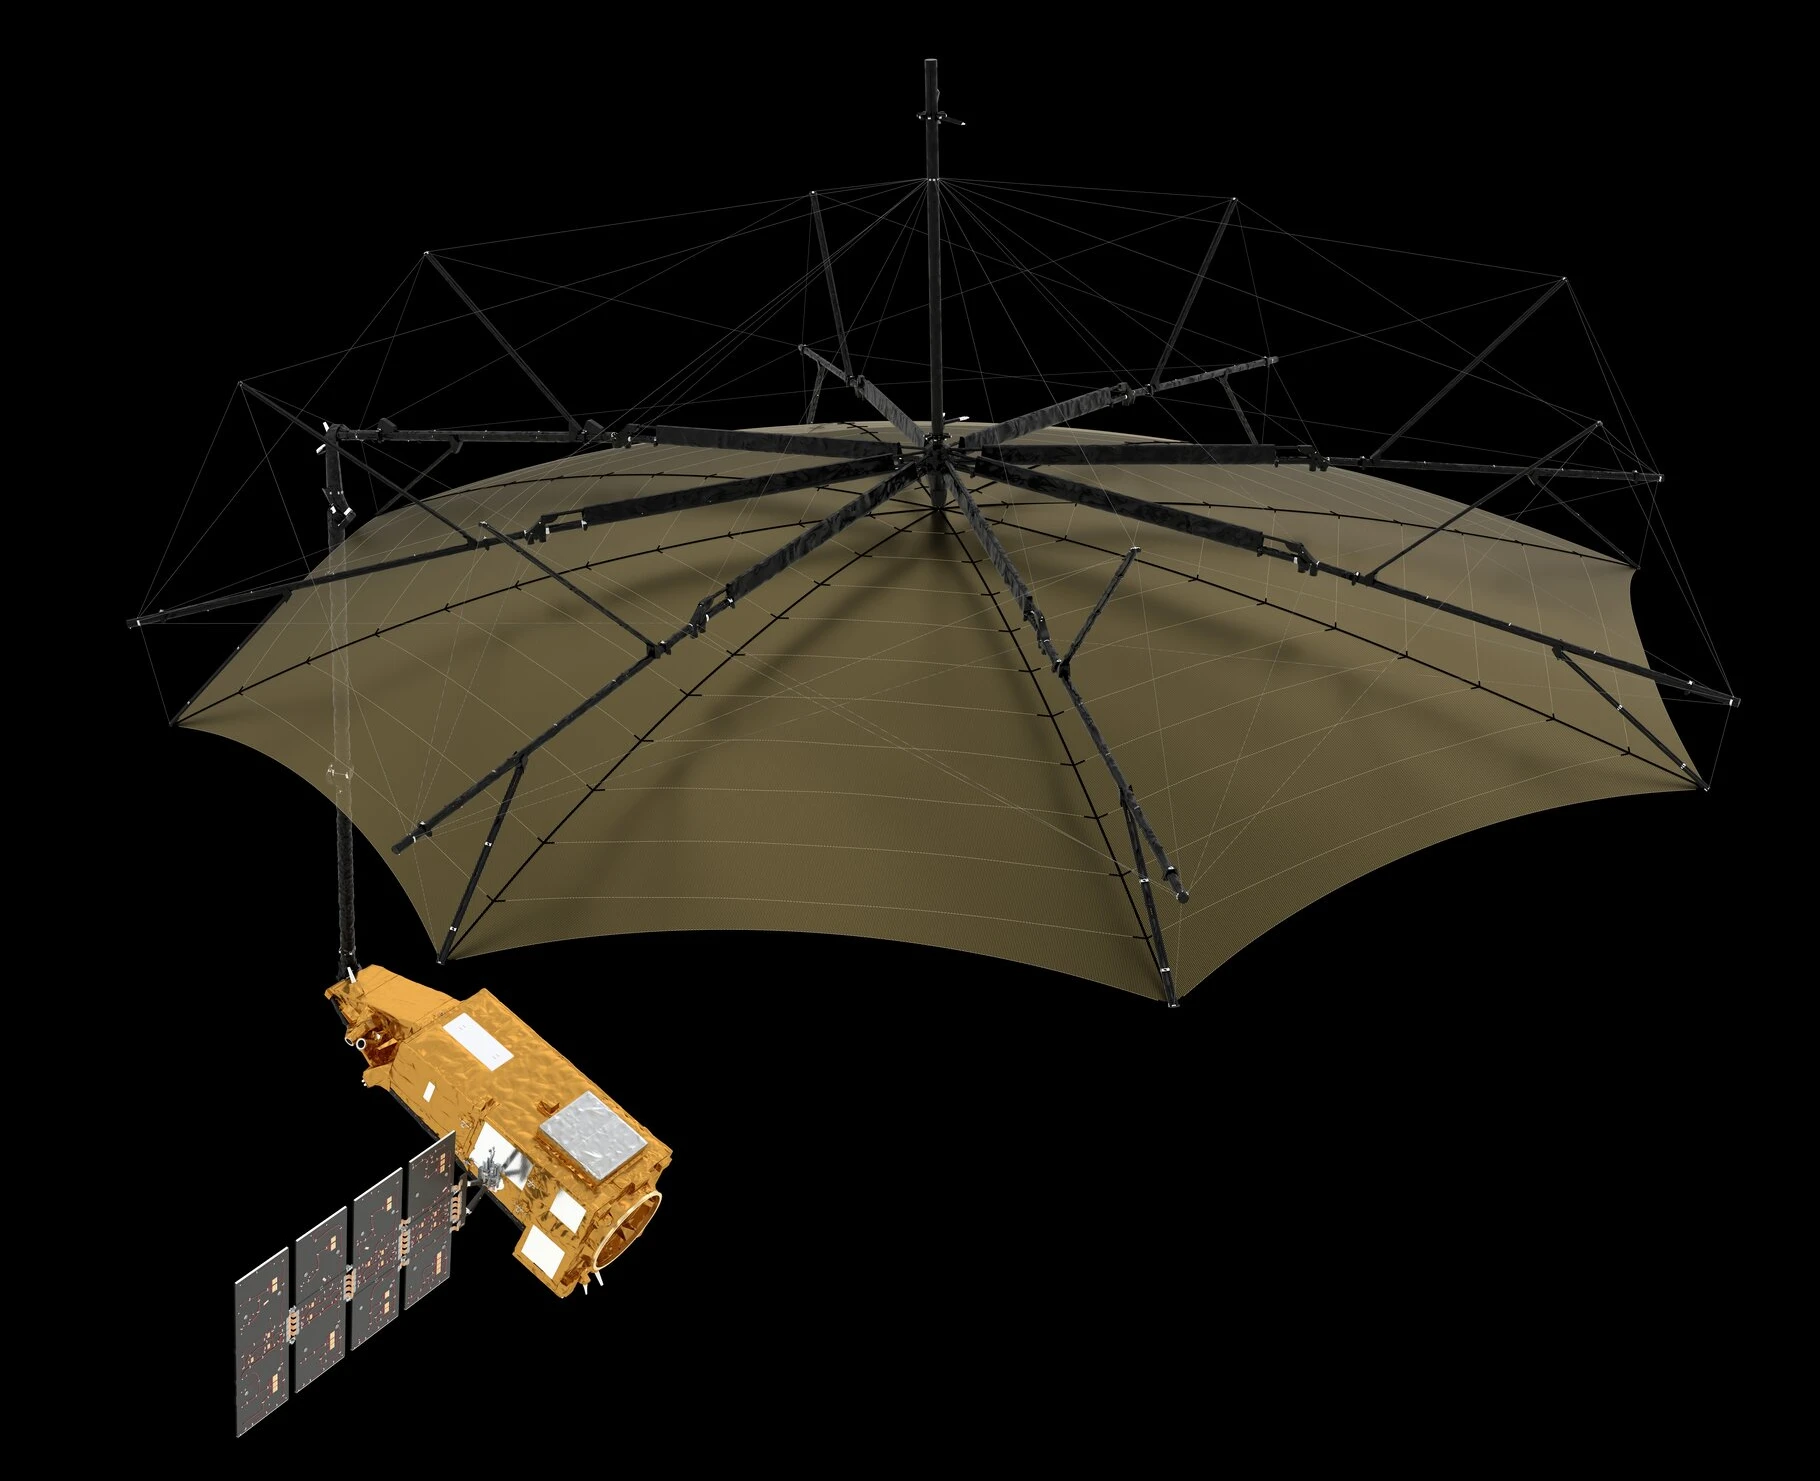
The ESA Biomass satellite (illustrated below), launched in April 2025, has a 12m aperture wire-mesh reflector and will orbit Earth in a Sun-synchronous dawn-dusk orbit at an altitude of 666km. It is the cornerstone of an ambitious mission designed to globally measure forest biomass, using the first-ever space-borne P-band SAR sensor. This operates at a low frequency, enabling it to penetrate even deeper into forest canopies compared to other radar frequencies.
Project Approach
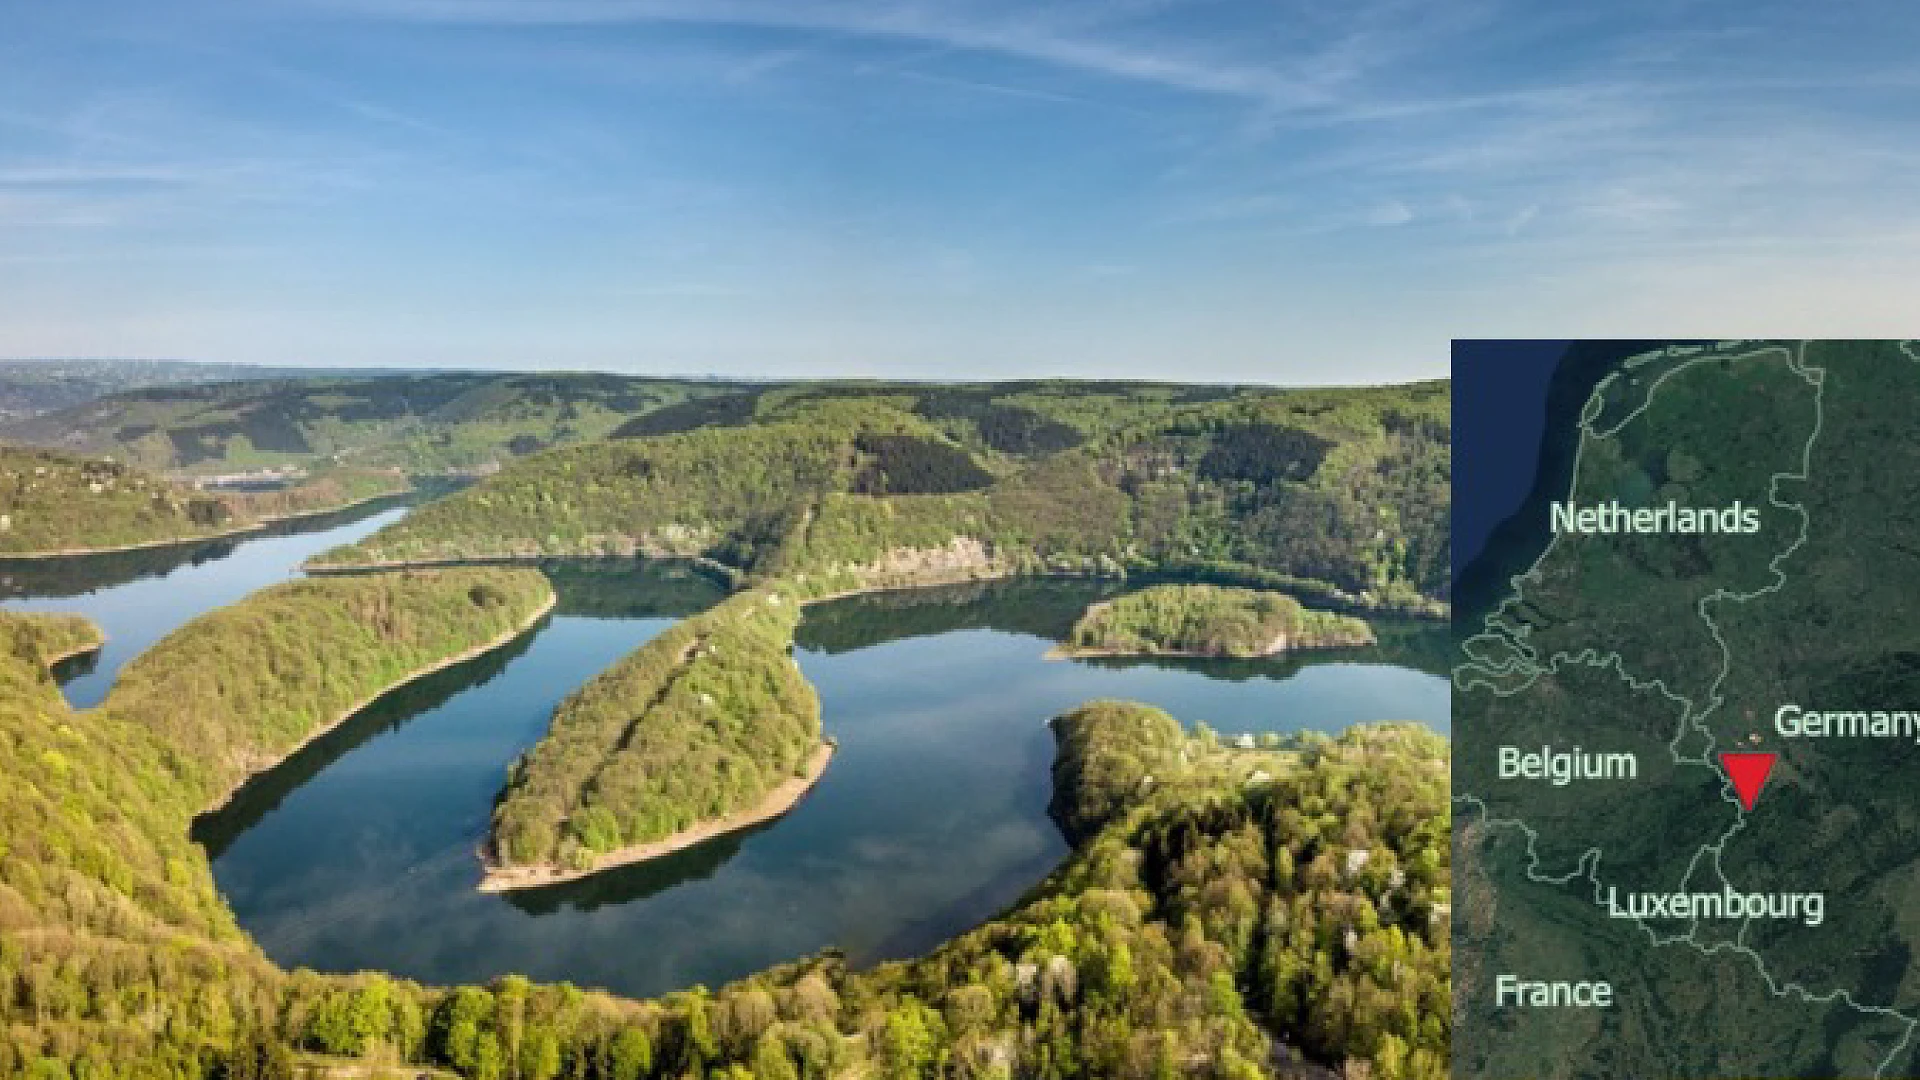
In order to build a dataset for their experiments the team combined numerous sources capturing varying attributes. All were taken in a study area within the Kermeter area of the Eifel National Park in North Rhine-Westphalia, Germany - an upland region reaching up to 528 meters above sea level, featuring one of the largest continuous deciduous forests in the region, spanning 3,592 hectares.
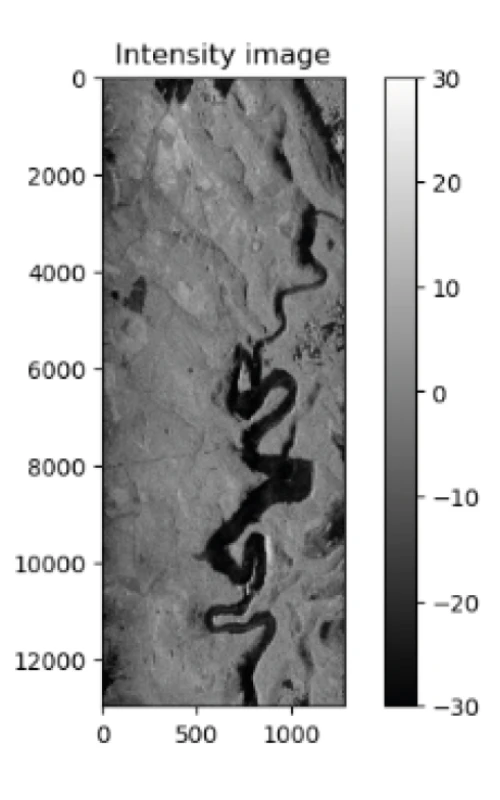
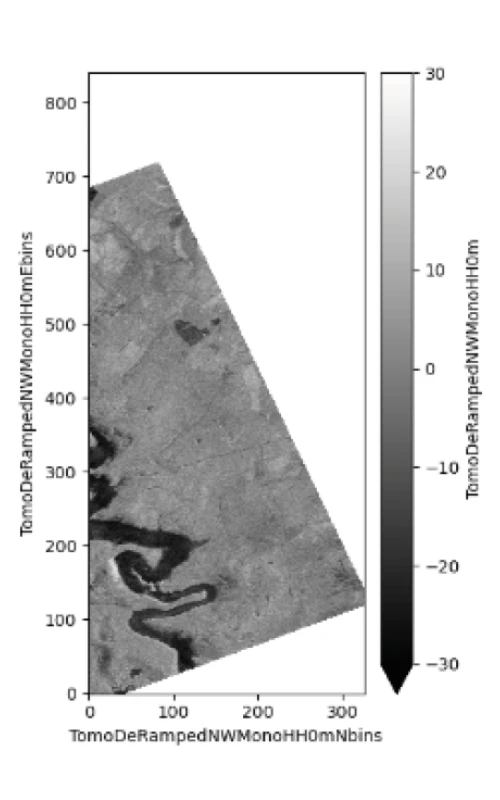
The team used the TomoSense Dataset which provided a set of 30 calibrated 2D SLC images. SLC or Single Look Complex images represent the raw, unprocessed output from SAR systems and provide high-resolution data that captures how radar signal intensity interacts with forest structures, such as tree canopies, branches, and trunks, offering unique insights into forest composition and condition. These SLC images were taken from different incidence angles captured by either a single plane (monostatic) or by two planes in tandem (bistatic), and two SAR wavelengths were used at the L- and P-bands, as shown below.
| Band | Number of Passes | Wavelength | Bandwidth | Slant range resolution | Azimuth Resolution | Vertical Resolution |
|---|---|---|---|---|---|---|
| P | 28 | 69cm | 30MHz | 5m | 1m | 3m |
| L | 30 | 22cm | 50MHz | 3m | 55cm | 1.3m (monostatic) 2.3m (bistatic) |
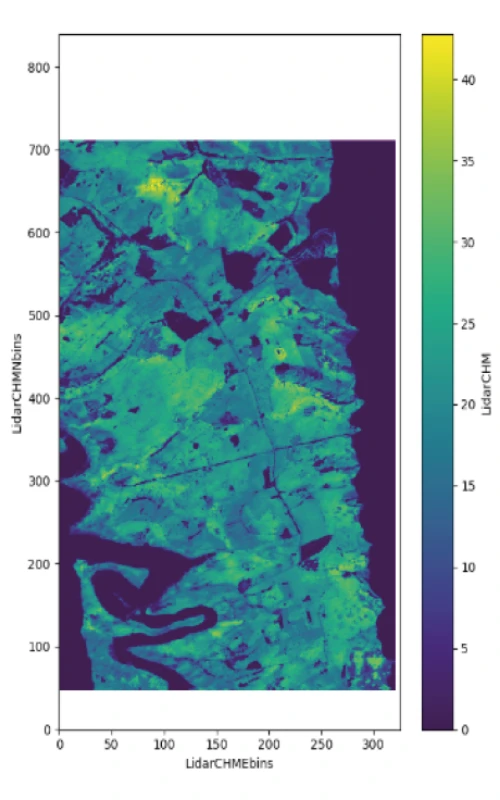
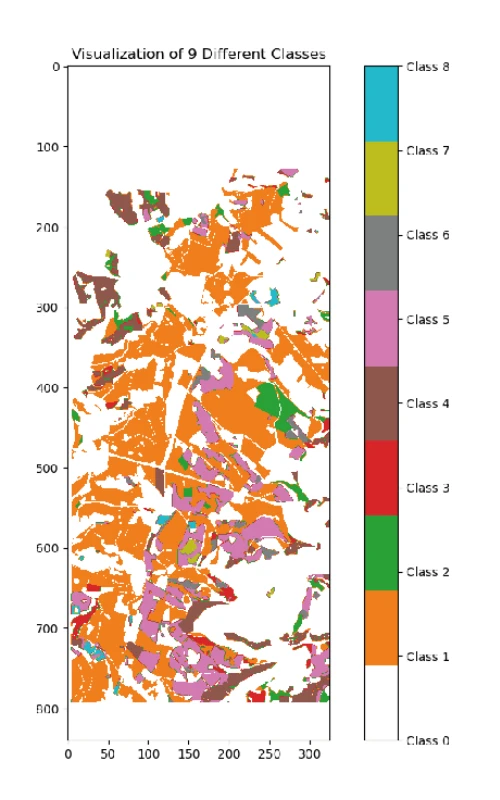
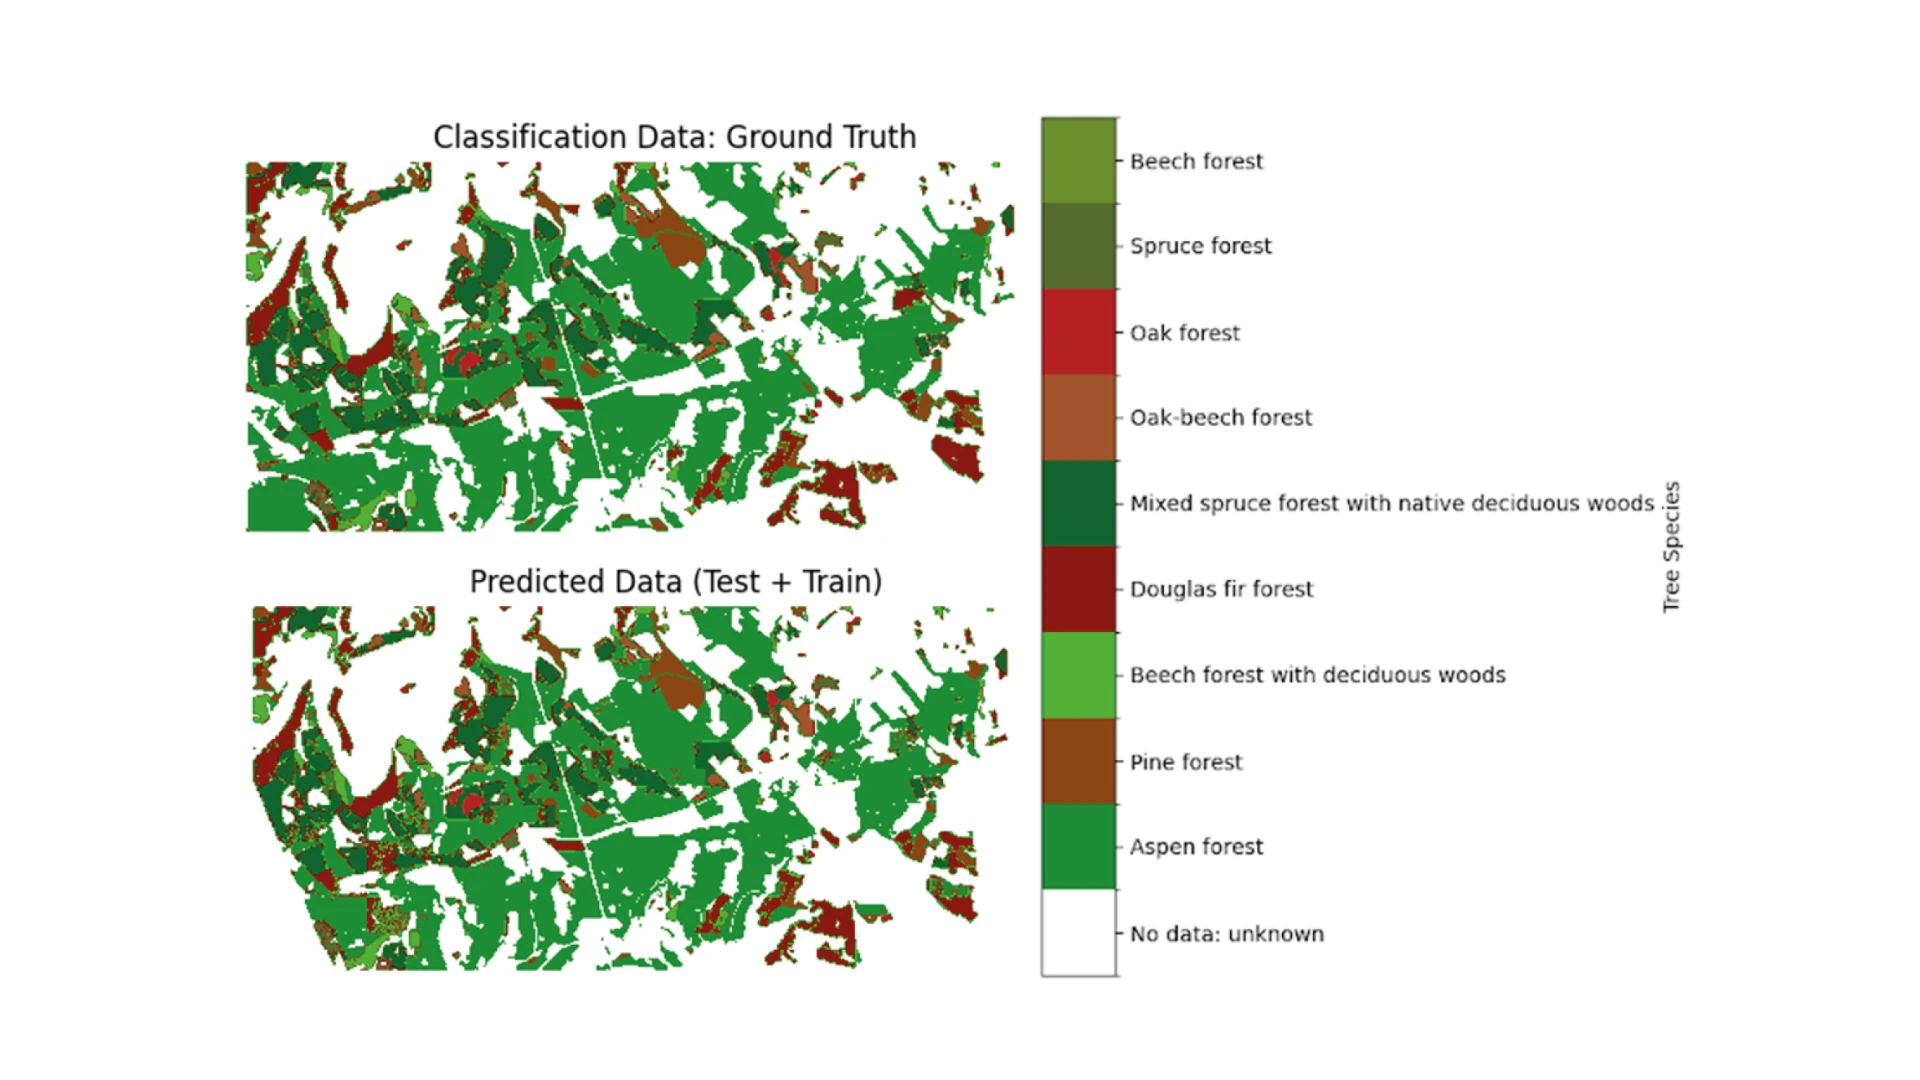
The team also supplemented their SAR data with LiDAR (Light Detection and Ranging) data plus tree height and species mapping data acquired by an Aerial Laser Scanning (ALS) airborne survey. This tree classification dataset included eight species of tree located within the study area, classified by both tree count and percentage coverage. The four datasets are summarised below.
The combined dataset was then geographically divided into distinct training, testing, and validation sets to ensure robust model generalisation to previously unseen areas. The team then employed both classical machine learning (ML) and deep learning (DL) approaches for tree height estimation and species classification respectively. For the machine learning model, the 3D TomoSAR data was transformed into a tabular format, where each height slice from the tomocube was treated as an independent feature. AutoGluon, an AutoML tool, was used to streamline model evaluation and selection, automating the process of identifying the best-performing model. In parallel, a deep learning pipeline was developed using a 3D Convolutional Neural Network (CNN) based on two versions of the U-Net architecture - a deep version with four encoder/decoder layers and a shallow version with three layers. The models were trained using the Adam optimiser, with Mean Square Error (MSE) as the loss function, and validated using a custom Mean Absolute Error (MAE) metric to minimise edge effects. A summary of the ML and DL pipelines are illustrated in the diagram below.

To test the validity of their ML and DL models, two experiments were carried out - a heading performance comparison, looking at model performance based on the orientation of the images taken (either NW or SE); and an input optimisation, that explores the impact of varying the number of SLC images on model performance.
Project Results
For the heading performance comparison experiment, the orientation of the electromagnetic waves transmitted and received by the emitting device is a key metric. There are a number of options - HH Horizontal-Horizontal, where both transmitted and received waves are horizontally polarised; HV Horizontal-Vertical, where the transmitted wave is horizontal, but the received wave is vertical; and VV Vertical-Vertical, where both transmitted and received waves are vertically polarised. For the SE heading, models trained on data filtered to exclude areas below 5 meters in height showed significant improvements in MAE with increasing numbers of SLC inputs. Specifically, increasing from three to seven SLC inputs reduced the test MAE by an average of 8%, with further improvements observed when using the full 28-image stack. The vertical-vertical (VV) polarisation channel demonstrated superior performance across all SLC input scenarios, as illustrated opposite.
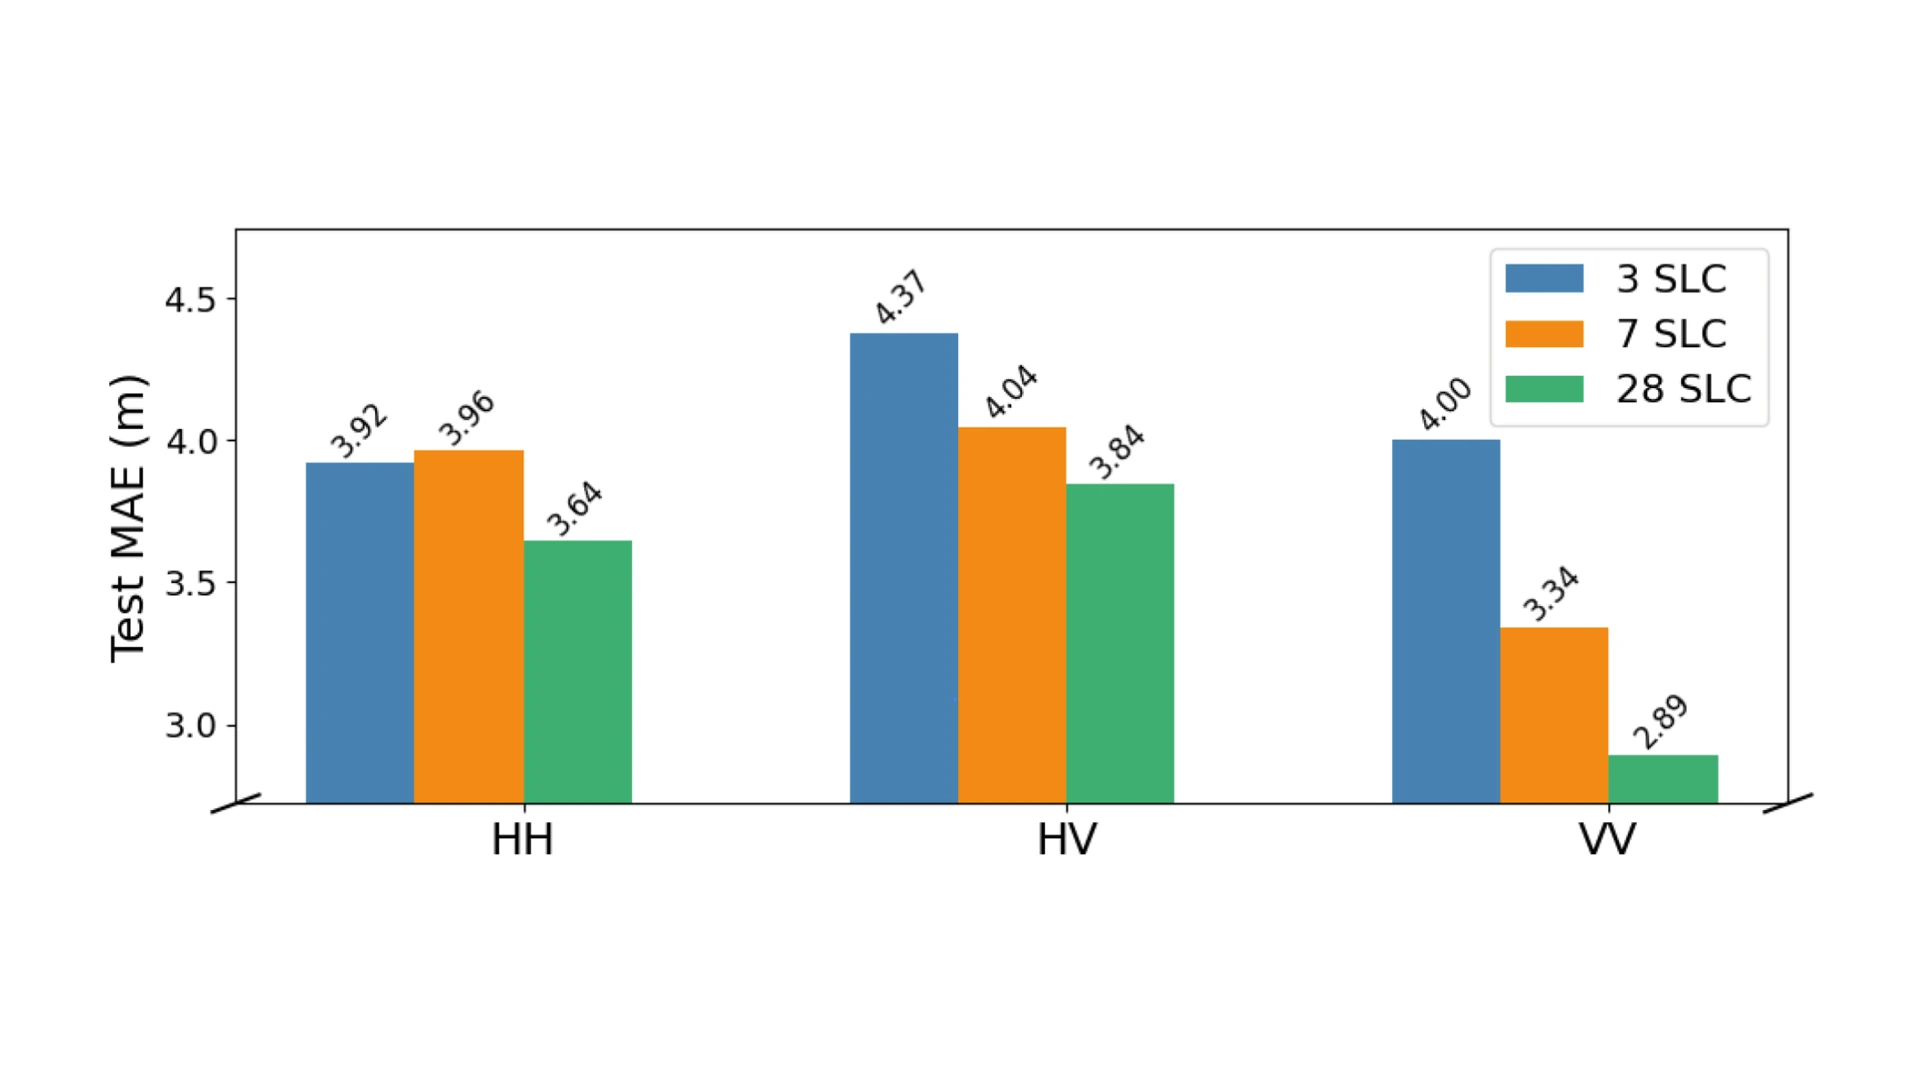
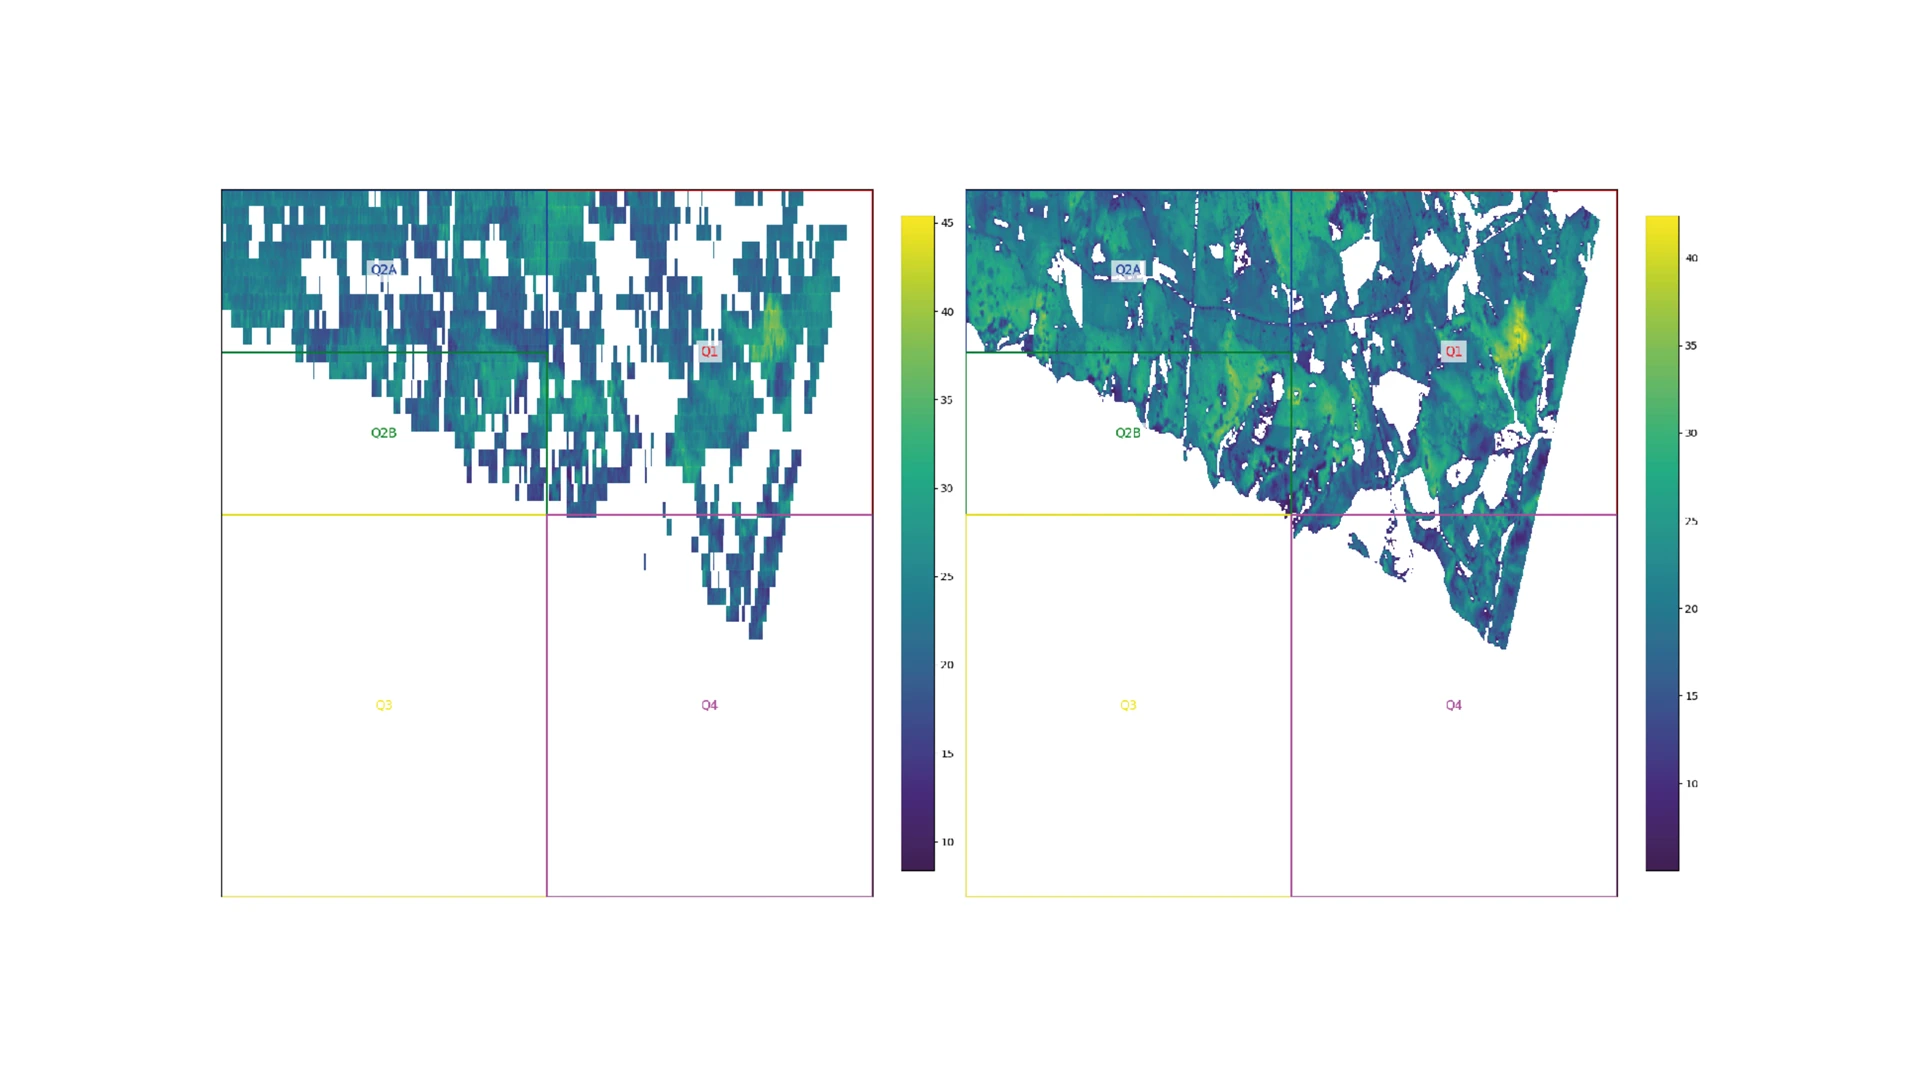
Reduction in MAE from 3 to 7 SLC images for VV was 17%, and this increased to 28% when 28 MLC images were used. Although this may have been expected given VV sensitivity to vertical structures such as tree trunks and echoes, it proved the VV data was best suited to the tomographic canopy height forest reconstruction and LiDAR analysis illustrated opposite.

When it came to tree classification, despite achieving an overall classification accuracy of 72%, the team's model exhibited a notable disparity between the performance of the majority class and the minority classes. The dominant class, Aspen, which constituted 64.3% of the samples, achieved a high F1-score (a measure of predictive performance) of 0.84. However, minority classes, such as Oak and Beech forests, showed much lower F1-scores, often below 0.30, suggesting the model may be overfitting to the majority class and struggling to learn from the underrepresented classes. This is graphically represented in the diagram opposite.
When compared to prior studies utilising full-stack tomographic SAR data, the ESL team's approach using SLC image stacks showed a competitive performance, albeit with a higher MAE in scenarios involving fewer input images.
Conclusions
Although the team found limitations include dealing with edge effects and generalising models across datasets, when it came to tree height estimation, the research advances tomographic SAR technology in forestry, offering a promising approach for higher-resolution solutions, with public release of model parameters facilitating further progress. Furthermore, for tomographic SAR reconstructions, the team emphasised the potential of deep learning models such as U-Net for estimating forest canopy height from SAR data, offering a more efficient method than traditional tomographic processing. Key findings showed that increasing the number of SLC inputs improves accuracy, with the VV polarisation channel performing best. Finally, the work underscores the potential of 3D tomographic SAR data for tree species classification while acknowledging challenges, particularly in classifying minority species within an imbalanced dataset. Future research should focus on testing the model son larger datasets and improving classification methods for underrepresented species.
You can learn more about Earth Systems Lab 2024 research and this 3D SAR for Forest Biomass project by reading the ESL 2024 RESULTS BOOKLET.
The Scan Partnership
Scan is a major supporter of ESL 2024 and FDL Europe, building on its participation in the previous four years events. As an NVIDIA Elite Solution Provider Scan contributes multiple DGX supercomputers in order to facilitate much of the machine learning and deep learning development and training required during the research sprint period.
Project Wins
Successful demonstration of improvements in 3D tomographic mapping of forest biomass, using ML and DL as opposed to traditional approaches
Time savings generated during eight-week research sprint due to access to GPU-accelerated DGX systems
James Parr
Founder, FDL / CEO, Trillium Technologies
“FDL has established an impressive success rate for applied AI research output at an exceptional pace. Research outcomes are regularly accepted to respected journals, presented at scientific conferences and have been deployed on NASA and ESA initiatives - and in space.”

Dan Parkinson
Director of Collaboration, Scan
“We are proud to be continuing our work with FDL and NVIDIA to support the ESL 2024 event for the fifth year running. It is a huge privilege to be associated with such ground-breaking research efforts in light of the challenges we all face when it comes to life-changing events like climate change and extreme weather.”
Speak to an expert
You’ve seen how Scan continues to help the Earth Systems Lab...
Related content
View more case studies
FDL Europe — Earth Systems Lab
Discover more about how Earth Systems Lab applies AI technologies to space science.
Read More