
Earth Systems Lab 2024 Case Study
Earth Systems Lab 2024
3D Clouds using Multi-sensors
PUBLISHED 19 JUNE 2025
Earth Systems Lab (ESL) by FDL Europe, applies AI technologies to space science, to push the frontiers of research and develop new tools to help solve some of the biggest challenges that humanity faces. These include the effects of climate change, predicting space weather, improving disaster response and identifying meteorites that could hold the key to the history of our universe.
FDL Europe is a public-private partnership with the European Space Agency (ESA) and Trillium Technologies. It works with commercial partners such as Scan, NVIDIA, IBM, Google, Airbus amongst others to provide expertise and the computing resources necessary for rapid experimentation and iteration in data intensive areas.
ESL 2024 was a research sprint hosted by the University of Oxford, taking place over a period of eight weeks in autumn 2024. The interdisciplinary teams address tightly defined problems and the format encourages rapid iteration and prototyping to create meaningful outputs to the space program and humanity.

Project Background
Clouds significantly influence global temperatures by interacting with radiation. On a global scale, they both cool the Earth by 12°C by reflecting incoming sunlight and warm the planet by 7°C by absorbing outgoing thermal radiation. This combination leads to an estimated net cooling effect of 5°C. However, not all clouds affect the climate in the same way - whether one specific cloud has a net warming or cooling effect is determined by a variety of factors, such as its evolution throughout the day, its thickness, and most crucially, its height in the atmosphere. As our climate changes so will clouds, but it is not exactly known how they will respond since the vertical distribution of clouds strongly influences their radiative properties. To better understand the likely outcomes global 3D observations of clouds are needed.
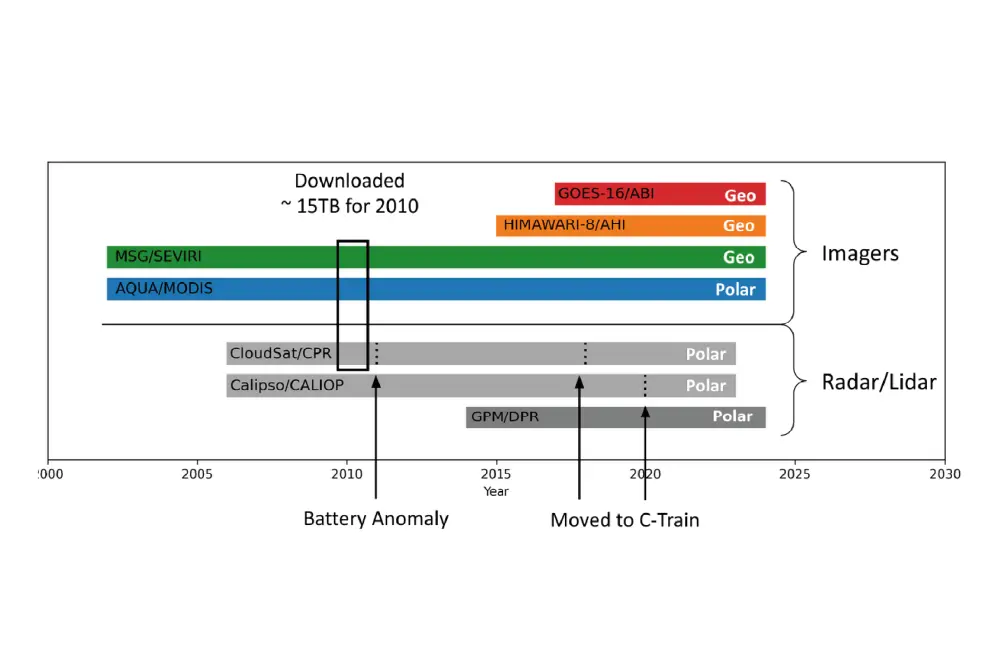
Currently clouds are observed on a global scale using a large number of satellites, either geostationary, known as the A-train, or polar orbiting, known as C-Train. NASA has a constellation of polar-orbiting satellites that provide vertical profile observations from 2D vertical lidar and radar profiles. The key limitation of this data source is its low sampling frequency - every 16-25 days for active sensor satellites due to their narrow swath, and daily for passive sensor satellites. There are however, geostationary satellites which provide multi-spectral images every 10-15 minutes albeit at slightly lower spatial resolution.
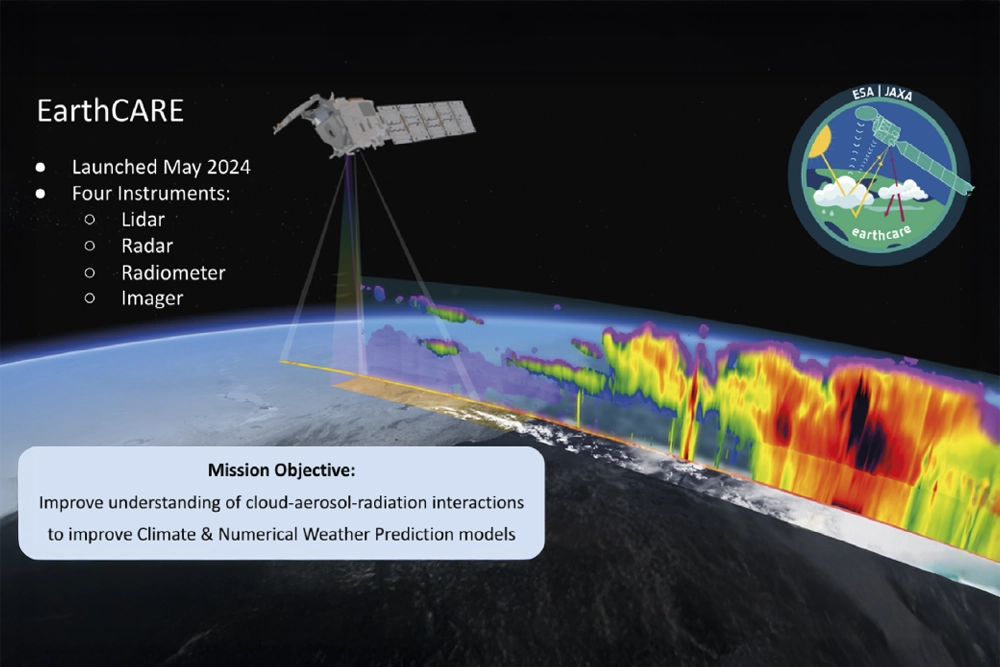
To provide better cloud data, ESA recently launched the Earth Cloud Aerosol and Radiation Explorer (EarthCARE) satellite (illustrated above), which is equipped with four state-of-the-art instruments: multispectral imager, radar, lidar and broadband radiometer. Observations by the EarthCARE instruments will provide novel insights into the role that clouds and aerosols play in regulating Earth’s climate, however, being a polar-orbiting satellite, the temporal resolution of its observations is limited.
Project Approach
Although there is a diverse range of satellites used to observe clouds from space, none of them provide the ideal dataset of cloud observations, which would have a high temporal and spatial resolution, a large spatial extent (global), and provide imagery as well as vertical (3D) data. In this project, the 3D Clouds team wanted to address this issue by leveraging machine learning to fuse these diverse data sources into a single model to thereby overcome their respective limitations, and create a more comprehensive and continuous understanding of cloud dynamics.
To make the combined dataset of around 15TB, information was gathered from three satellite sources, as shown in the diagram below. Firstly, observations from CloudSat’s Cloud Profiling Radar (CPR), with a horizontal resolution of 1.1km and a vertical resolution of 240m, providing vertical radar reflectivity profiles of clouds between the surface and 25km altitude. Secondly, images taken by the AQUA satellite’s Moderate Resolution Imaging Spectroradiometer (MODIS) instrument, which provides imagery in 36 spectral bands across the visible and infrared spectrum. Thirdly, from the Meteosat Second Generation (MSG) satellite’s Spinning Enhanced Visible Infra-Red Imager (SEVIRI) instrument, which generates imagery from 11 visible and infrared bands with a resolution of 3km, along with a wideband visible channel with a higher resolution at 1km. For each satellite, data from 2010 was chosen, as CloudSat suffered a battery anomaly in 2011, limiting its operational capabilities.
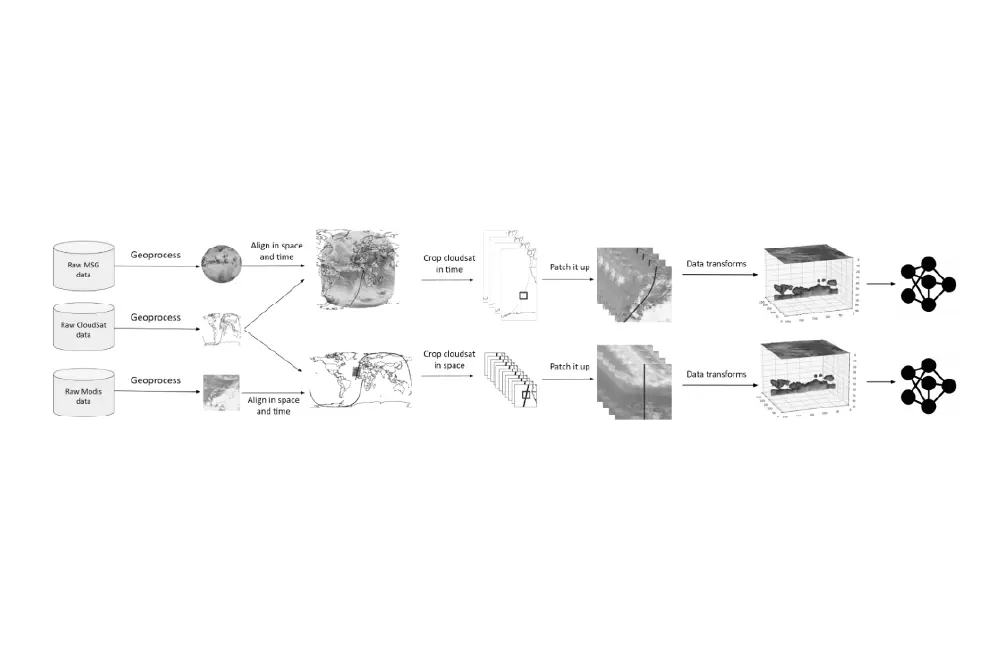
The team aligned these images with the vertical profiles spatially and temporally to create a dataset by first geo-processing the raw data files to correctly assign latitude - longitude information, and to stack relevant data products. They then cropped the geo-processed data in space and time to align the CPR cloud profiles with the input satellite imagery. Next, they created 256x256 pixel patches of consistent shape to feed into the machine learning model, and finally performed data transformations to optimise the training. These included cropping the height of the CloudSat data, normalising the different spectral bands, and transforming the data from 2D to 3D, using the height level of the CloudSat data as the third dimension. The data pipeline is illustrated below.
As the MSG/SEVIRI data encompassed TBs of observations without corresponding CloudSat overpass values, the team decided to use models based on self-supervised learning (SSL). They employed Masked Autoencoders (MAE) with Vision Transformer (ViT) backbones to tokenise the input satellite images and learn local features and their spatial relationships through positional encodings. The positional encodings introduced in the ViTs assign unique positions based on each token's index along the x and y axes, introducing spatial awareness across the input image. Given their geospatial data, they also adapted the SatMAE framework incorporating a temporal encoding alongside a static positional encoding. While the original SatMAE implementation only encodes the date of an input image, the team’s amended approach encoded both date and time (critical for the dynamic evolution of clouds) and spatial coordinates (centre latitude and longitude) to enhance the model’s understanding of geospatial features and relationships.
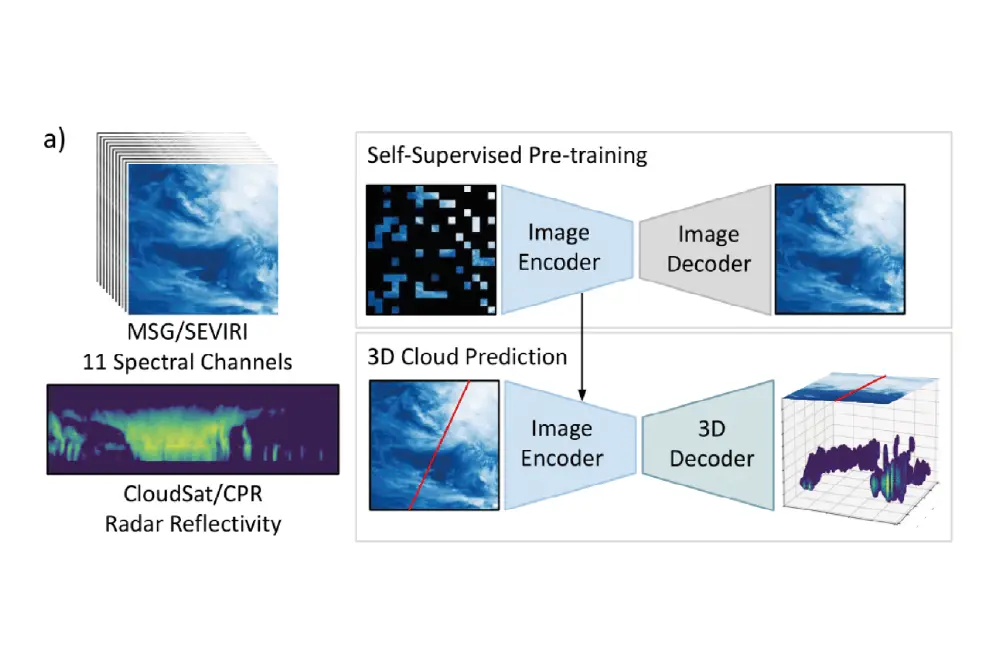
As demonstrated in the diagram above, following self-supervised pre-training, the team replaced the decoder with a regression head using transposed convolutional layers, and fine-tuned the models for their 3D cloud reconstruction task.
Project Results
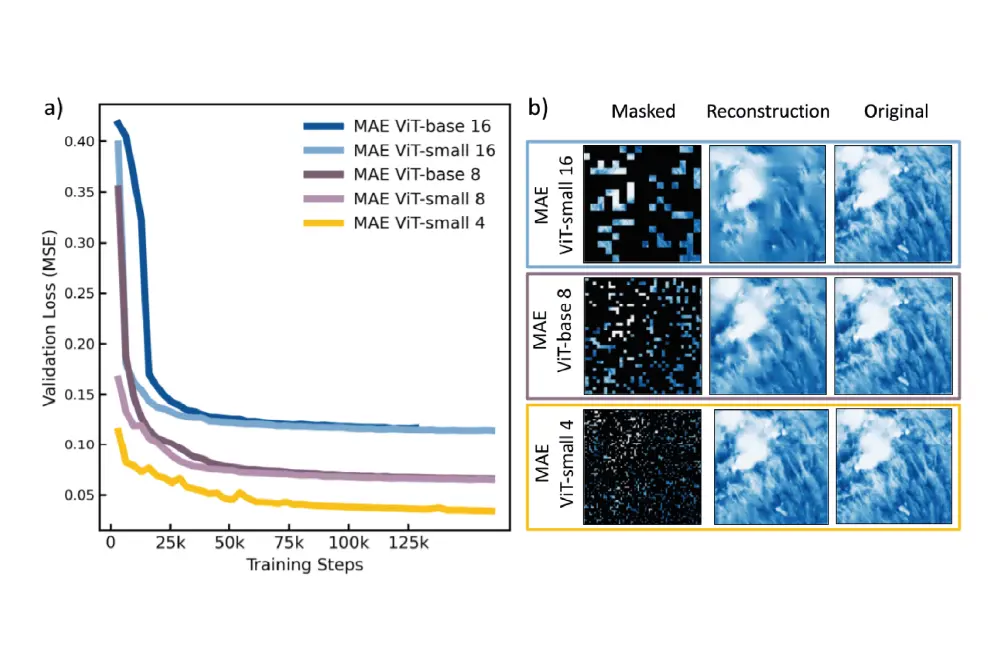
The team experimented with different sizes of ViT backbones and tokenisation schemes. As illustrated in the diagram below, smaller ViT tokens yielded lower losses and finer-grained detail in the image reconstruction. An especially strong visual improvement was seen when moving from 16x16 to 8x8 and 4x4 pixel tokens, with finer grained reconstructions of small-scale cloud features. Since the small and base MAE models exhibit comparable performance, they chose the smaller ViT for its reduced computational demands.
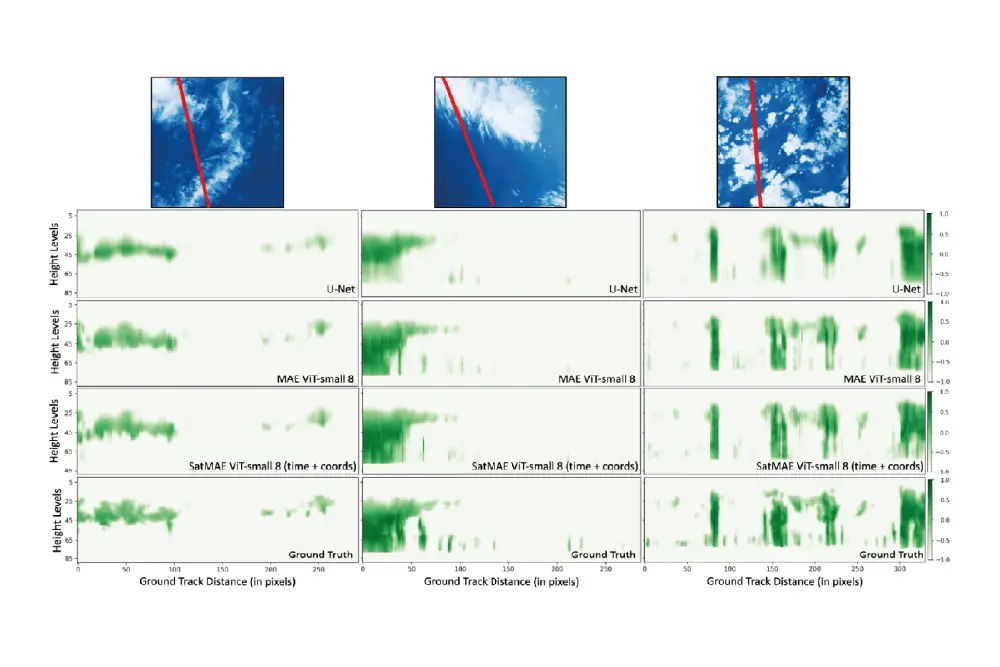
Having demonstrated the benefit of self-supervised training with ViT backbones that encode small-scale cloud features, they now compared the standard MAE to their space- and time-aware SatMAE model. Looking at the perceptual quality of the predicted cloud profiles, the MAE and SatMAE models resulted in visually sharper reconstructions than their U-Net baseline. The diagram below of a predicted 3D cloud volume, shows good qualitative agreement with where clouds appear to be in the input MSG / SEVIRI ground truth image.
The team then wanted to investigate cloud type prediction using f1 scores (a machine learning evaluation metric) to measure the model's accuracy in correctly. Again, the SatMAE and MAE models achieved lower errors compared to the U-Net baseline results, in all cloud types with the exception of nimbostratus - rain and storm clouds with high radar reflectivities - as shown in the diagram below.
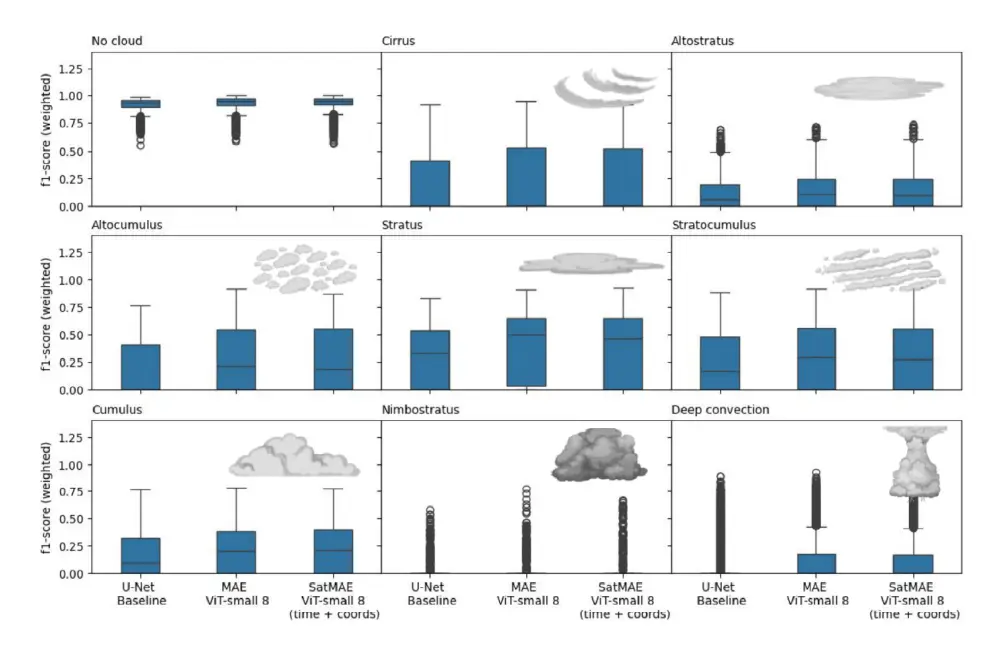
However, it is not clear whether the SatMAE model obtains better f1 scores than the MAE model.
Conclusion and Next Steps
In conclusion, the team used SSL via MAEs to pre-train models using unlabelled MSG / SEVIRI images, and then fine-tuned the models for 3D cloud reconstruction, using aligned pairs of MSG / SEVIRI and CloudSat / CPR radar reflectivity profiles. In addition to the standard MAE implementation, they adapted a SatMAE model to encode the date, time, and location of the input data. Compared to the U-Net, the machine learning baseline for this task, their models showed improved performance when predicting radar reflectivity. While the improvements were moderate when averaged across the whole test set, finer grained visualisation of the predictions highlight that the SatMAE model achieved the lowest errors in the tropical convection belt, demonstrating its superior generalisation.
You can learn more about Earth Systems Lab 2024 research and this 3D Clouds using Multi-sensors project by reading the ESL 2024 RESULTS BOOKLET, where a summary, poster and full technical memorandum can be viewed and downloaded.
Project Wins
Successful demonstration of HelioWatch framework in improving solar flare and CME detection
Proposal of a move away from binary flare labelling strategies to better regression or multi-timestep options
Time savings generated during eight-week research sprint due to access to GPU-accelerated DGX systems
James Parr
Founder, FDL / CEO, Trillium Technologies
“FDL has established an impressive success rate for applied AI research output at an exceptional pace. Research outcomes are regularly accepted to respected journals, presented at scientific conferences and have been deployed on NASA and ESA initiatives - and in space.”

Dan Parkinson
Director of Collaboration, Scan
“We are proud to be continuing our work with FDL and NVIDIA to support the ESL 2024 event for the fifth year running. It is a huge privilege to be associated with such ground-breaking research efforts in light of the challenges we all face when it comes to life-changing events like climate change and extreme weather.”
Speak to an expert
You’ve seen how Scan continues to help the Earth Systems Lab and FDL Europe further its research into the climate change and space. Contact our expert AI team to discuss your project requirements.
Related content
View more case studies
FDL Europe — Earth Systems Lab
Discover more about how Earth Systems Lab applies AI technologies to space science.
Read More